Text output generated by analyses conducted in Idiogrid is sent to the Text Output child window in the program. This output can be edited in a number of ways. For example, the font of the text can be manipulated, and text can be deleted and copied to or pasted from the Windows clipboard. The text can be saved in ASCII format or as a Rich Text file (.rtf) that will preserve the different font characteristics. ASCII and Rich Text files can also be loaded into the text output window of Idiogrid. The decimal precision of newly created numerical output (but not existing numerical output) can also be changed. Numbers can be printed with up to fourteen decimals.
A screen snapshot of Idiogrid's Text Output window can be viewed here
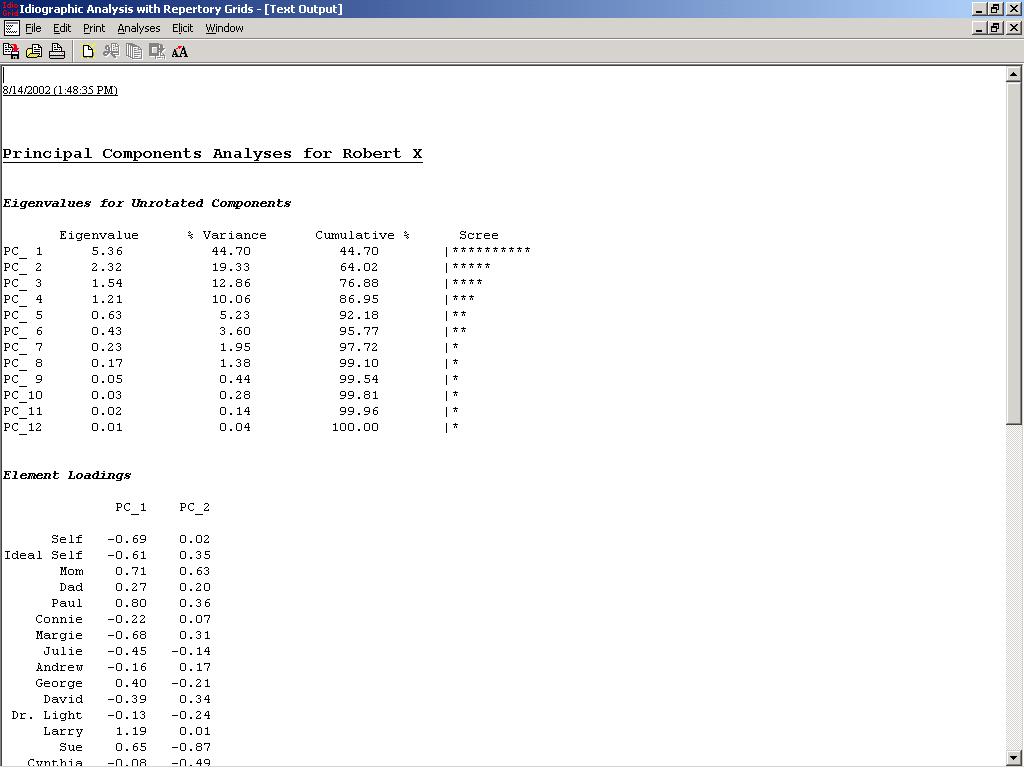 .
.
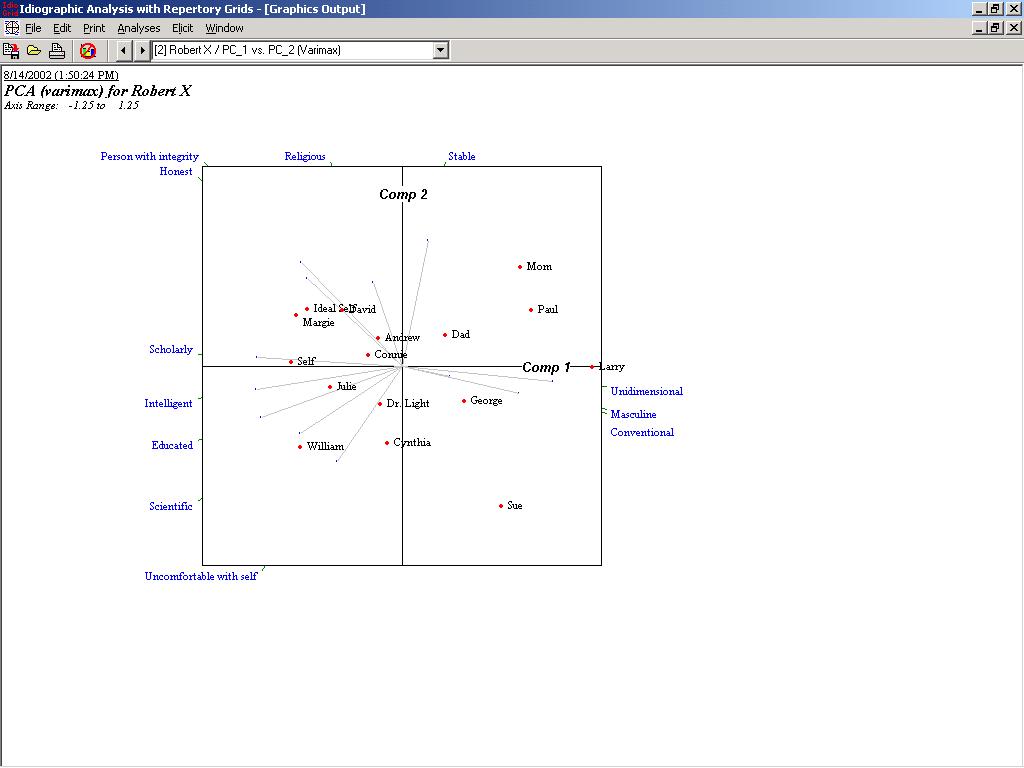
Graphical displays generated by analyses conducted in Idiogrid are sent to the Graphics Output child window in the program. These displays can be printed or they can be saved as bitmap (.bmp), JPEG (.jpg), or Windows metafiles (.wmf). Window metafiles are particularly flexible, because they can be edited in many different Windows programs such as Word and Powerpoint. Other bitmap, JPEG, and metafiles created by different programs can also be loaded into the graphics window of Idiogrid.
A screen snapshot of Idiogrid's Graphics Output window can be viewed here
Grids can be printed with clinical or research notes. The elements and constructs are printed with the grid as column and row labels, respectively. The text in the Text Output window can be printed as well as the graphs in the Graphics Output window. Landscape or portrait pages can be printed, and other printer options can be manipulated as well.
Another useful feature in Idiogrid is the ability to save matrices from different analyses as grids in the Grid Data window. For example, the construct and element correlations requested from the Bivariate Statistics option can be automatically saved as grids in the Grid Data window. Once these matrices are set up as grids, they can be edited, saved, merged, concatenated, exported, or subjected to other analyses.